Beyond Price Action

Today's open and first trade entry

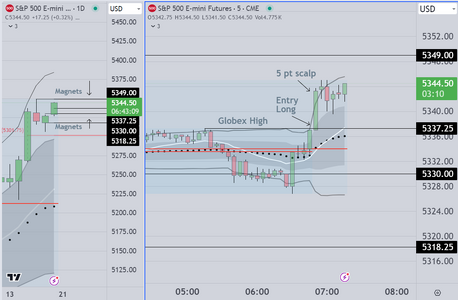
As seen in the chart, the market gapped up
and ran. This would have been easier for retail traders
to see using 15 min candles

The problem for retail traders is that because they lack
experience, they do not know that a close above the 1st SD
confirms the breakout

As a result they are "trapped out". This means that instead of
recognizing the breakout and entering AT the next bar's open
they often chase the market, thus exposing themselves to
unnecessary risk. Also because they trade "for ticks", they almost
always do not hold long enough to take a "full scalp" (in this market
a full scalp is 3-5 points). Failure to hold means that when they do lose
on a later trade, they usually cannot overcome losses on the longer
(and more important) time frame. Thus they are net losers. This is an
important lesson that eventually they have to learn if they are going
to make a living in this business

A Final Note

I had several traders watching me today and they suggested that it was
difficult to "pull the trigger" on this trade setup. In response I said
"Okay then, lets review. Please remember that (at the time) I suggested
that this was a low probability setup, a little over 60% odds ordinarily
however the context is as follows,

The open is the time when highest volatility exists in the market as
institutions make decisions to put money to work. This is when THEY
need to see range expansion in order to make a reasonable profit

So the real odds are much better then one might expect, and in my
opinion it was worth it to take this trade, even though it is early
and we will likely have many other opportunities later.

Should have also mentioned that in the pre-open comment
we suggested that the overall bias was up. If you have our
standard display in front of you, you will note that the daily
chart shows this, as well as the upside magnets

Traded perfectly it was a 7pt winner, I took 5 pts (a standard scalp)
If I were wrong, I would have taken a 2 or 3 pt loss. in these circumstances
I suggest traders enter on small size and hold


Good luck traders
 

Attachments

  • Monday Open 5-20-2024.PNG
    Monday Open 5-20-2024.PNG
    106.6 KB · Views: 31
Last edited:
This will be my last trade, and that is to emphasize the
point I made earlier.

On this last chart, notice the spike down as institutions and
commercials all seem to get out at about the same time
This important "time based pivot" is known as the Euro/USA
Overlap, where Euro traders close their books.

Again, most of the traders watching me could not pull the trigger
even though this has been explained several times.. I get it. It is
counterintuitive however at some point you have to adapt to
reality right?

This was a reasonably good day characterized by 1) an early move
(gap and run), followed by 2) trading range. The trading range
was also anticipated (if you did your homework, reviewing typical
Monday price action)

For those who had difficulty, I hope you are trading simulated
accounts. Tomorrow is a new day
 

Attachments

  • Euro-USA Overlap Short.PNG
    Euro-USA Overlap Short.PNG
    94.6 KB · Views: 13
Last edited:
I will be transitioning to Instagram shortly
but before I do, I want to offer these last
examples showing how I frame each session

There will be two (2) charts, the first will show
the use of VWAP. While posting here I learned
that readers do not want to get into the math
so I will not present it in this venue

What I will say is that this part of the method
is widely used by both institutional and commercial
traders AND it is the basis for automated trading
programs as well. There are two (2) reasons why this system
works. First, it provides reliable buy and sell zones
Second it allows me to see when the distribution
is expanding, thus indicating a breakout (which allows
me to hold a position with confidence).

Attaching the first chart below
 

Attachments

  • Framing Method Part 1.PNG
    Framing Method Part 1.PNG
    142.4 KB · Views: 8
Last edited:
Here is example 2

As you can see, it is the same chart with FRVP
(fixed range volume profile). We use this tool
to obtain the statistical skew for a specific range
or prices. The red line is the POC. and its position
relative to the VWAP is the "skew". Absent a background
in basic statistics, we won't bother readers with the
math

On the chart, we show examples of positive, negative
and symmetrical skew. We explained it as simply as we
can in earlier posts. As the name implies, to use the
FRVP (correctly) one has to know where to anchor
each end of the FRVP. Once you have that ability
it takes a bit of repetition and then you can see
where price is likely to 1) reverse, 2) breakout, or
3) create a trading range. After that, all that is needed
is a reasonable setup.

Based on this system and a weekly/monthly review of session
data, we can calculate the odds that a specific setup
will succeed
 

Attachments

  • Framing Example 2.PNG
    Framing Example 2.PNG
    169.9 KB · Views: 7
Last edited:
And with that, I believe that I have completed the obligation
that I accepted to pay forward the gift that my mentor
provided me years back. I wish you all the best of luck
 
Last edited:
A quick note to inform that I have started a Facebook
page (Beyond Price Action) and will stage an event soon
For a period of two (2) days I will host a trading room live
interested traders can watch me as I go through the pre-
market chart markup and comment, and then trade
 
I have already posted some ideas, meant to assist struggling traders

One of those concepts is called the "Run-Up" or "Run-Up Trade" An associate of mine
also calls this "Stealing the Trade"

Basically, institutions and funds take advantage of a usually quiet overnight market
to move price in advance (news organizations often use the language "in the run-up to")
a specific high impact economic report. As I have mentioned in the thread "Long Road to
Success", this allows them to accumulate inventory, wait for the open of the RTH session
then sell the marked up inventory, thus realizing significant profit, with very little risk.

I have many examples (I use them for training purposes) and what you can see in the
current example is the "measured move" up just prior to the release of economic news
today.

I will post a few more charts and miscellaneous examples, and then I intend to continue
on with my own blog of the same name ("Beyond Price Action").

Wish you all the best of luck
That's why so many Euro and US sessions are just ranging markets.
 
Generally speaking, the institutions that produce the biggest volumes work on a different
premise than you might think. They use trading range days to accumulate or distribute volume
so that when high impact economic reports are released, they can either buy back (at wholesale value)
or sell relatively high priced inventory (at retail value). My approach to framing the markets begins with
looking at how the economic reports are scheduled at the beginning of each week and month. It takes
a bit of work, but once you look into it, you can see where we are in the cycle. Any good economic calendar
vendor will work, however I like to use investing.com for this purpose, and much of my (actual) prep is
done on the weekend.

This is why my screen display has two (2) components. on the left side a daily chart framed on a quarterly VWAP
envelope, and on the right side, either 15 min or 5 min candles, framed by a session VWAP envelope.
The reason I suggested that readers become reacquainted with basic statistics is that the envelope shows
two conditions, the first is a reversion to the mean, where price moves from the outer band toward the middle
(the VWAP median), and the second behavior is where the distribution expands (breaks out) and this is known
as "trend".
 

Attachments

  • Facebook Basic Display.PNG
    Facebook Basic Display.PNG
    138.1 KB · Views: 7
Last edited:
And here is the "reversion to the mean" example that I was talking about in the previous
post.

On the left side, the longer time frame chart shows the statistical skew (which was negative)

On the open we saw a wide range bar up to test the 2nd SD. Aligned with skew we saw sellers
come in to reverse the move creating a 2 bar reversal. Entry at the open of the 3rd bar resulted
in a profitable scalp as price moves back to the mean (the VWAP Median/black dots)
 

Attachments

  • Reversion to Mean Example.PNG
    Reversion to Mean Example.PNG
    126.3 KB · Views: 9
And by coincidence, we see that the skew (which of course is dynamic) changes
to symmetrical, as buyers enter the market. We see a series of strong bull bars
This type of reversal has good odds of success and although we did not take
the trade, the entry would have been above the 20 EMA (White Line). This is
an example of a "breakout" to the upside (confirmed by a close above the 1st SD)

This is a very common sequence of trades (known as an "Opening Reversal")

One of the most important lessons I can offer students is to anticipate these sequences
(and to use the restroom BEFORE the open, so that they don't miss trades like this :)
 

Attachments

  • Skew Transition Reversal Example.PNG
    Skew Transition Reversal Example.PNG
    162.1 KB · Views: 15
Last edited:
Hello

One of the problems that traders often encounter is lack of math background.
I suggest that aspiring traders take basic (first year) Statistics & Probabilities
otherwise they end up going in circles (for example). Here in the US, first year
Stats consists of about 20 weeks for the first part (100 level) and the same for
level 200

VWAP has to be started at the beginning of the current session.
Alternatively you can use the previous session as a starting point. In contrast
you can start the volume profile (POC) wherever you wish. One thing that has
to be pointed out is that you have to wait for a period of time, for the VWAP
POC combination to collect a stabile sample size. For my system, I like to wait
at least 15 minutes. (basic stats)

Using your chart, if the red line at the bottom is POC and the blue line is the
VWAP, refer to the paragraph below

If the POC is above the VWAP the skew is down, conversely if the
POC is below the VWAP the skew is up. If the VWAP is at or near the POC
then you have a symmetrical distribution and there is no skew. Finally, and
this should be self evident, price (the distribution of prices during a session)
is dynamic so the position of the POC will change relative to the VWAP as more
data is accumulated during the session.

Honestly there is a lot more to this than I can cover in one post. Again I suggest
the best place to start is with first year statistics. If time permits I will post some of
the basic math
I really like the content that you post, always informative and useful.
 
Hello FranziskaSchulz

Thank you for your encouraging and kind comment

My hope is to get traders to think and to learn concepts that might be helpful
This (trading) is a very competitive world, dominated by a small group of big
institutions. Most of what they do, is directed by software programs, and of course
some of it is the work of skilled professionals. The 1st tier firms hire people who
have advanced degrees in math and (almost always) computer science. They are
well paid to provide programs that can generate consistent profits. Most of what
I have learned is because a kind gentleman decided to help me years ago, by providing
me with the basics (that I introduce in my comments here). I have built on that basic
information and hope to show others how it can be used to create a viable business
model (and economic freedom).

I do this out of respect for the person (now gone) who helped me, and because I know that only a
small percentage of retail traders will take the time, and make the effort, to learn more about
this way of trading. Recently I have started a Facebook page (Beyond Price Action) and an
Instagram page (of the same title) and soon I will host some live events where traders can
watch me as I work. Its not my intention to serve as a signaling service. Instead I want people
to learn to think for themselves (and to find their own way). If you have an interest, keep in touch
with me and I will provide more help to you and others.


By the way, your name is an interesting one. I lived and worked in Germany for Dynamit Nobel
I almost never get to speak German here (in the USA) but I know that "Franziska" means "From
France" and also "Free", and a person of this name is said to be empowered to live life on their
own terms. Thank you again
 
Because this session was an excellent example of "Trading Range" behavior, I want to outline the basic approach
that I use.

1) Trading range behavior is common, at the open and on days when the market is anticipating high impact economic
data. This often occurs early in the week (and month) Trading range behavior is readily identifiable by candles that overlap
and have relatively small bodies and prominent tails
2) Skilled professionals will extend lines from the initial high and low closes, to define a range, then they will enter long or short
at the next test of the previous high or low. They are willing to scale in (to some extent) above and below the range, knowing that
even if price exceeds a previous high/close, it is probably not going very far.
3) Professionals also know that institutions have automated systems that use limit orders to trade these "ranges"

New or struggling traders should stand aside, and NOT TRADE during these conditions, unless or until they learn 1) how to mark up
a chart correctly AND 2) how to use limit orders Simulated accounts are excellent resources for learning how to handle "trading range"
behavior.
 

Attachments

  • Framing Trading Ranges.PNG
    Framing Trading Ranges.PNG
    176.1 KB · Views: 17
This evening I will talk about tools that professionals use regularly to obtain an edge
as they operate in the markets

1) Economic Calendars......Most professionals integrate knowledge of high impact
economic data into their trading plans. The largest institutions provide comprehensive
data to their traders, including consensus, and probable duration of impact on pricing.
Traders also know what behavioral patterns to expect, so that, they can make good
decisions as to timing of entry, risk, and how long to hold a position. Retail traders
are almost always at a disadvantage as regards this important trading tool.

2) Time Based Pivots....There are certain critical time periods that are important, including
the open and close, and the "Overlap", which is when Euro based traders start to
close their books. Prior to the open (in the US) traders also have the luxury of being
able to obtain the release of many high impact economic reports. This allows them
to plan their trades based on what they see in the hour preceding the opening
of BOTH the US stock market, which opens in a rotation, and the subsequent open
of the S&P Futures.

3) Monitoring and adapting to, the status of the US Stock Market and any scheduled
subsequent data releases as they occur throughout the day. Skilled participants follow
the market, and when they see a significant move (either way), it often impacts the
decisions they make, to hold, to add to, or modify existing positions.

These are some of the tools that skilled participants have available to them.. Typically
retail traders do not have knowledge of these tools, and/or do not know how to integrate
them into their trading process. As a result, retail traders are at a significant disadvantage

As we interact with new or struggling traders we "model" the same behavior we
teach to fund traders.

There are three (3) steps to our process

Step one........Education...we show traders our screen display and the background for framing
any liquid market

Step two........We outline the statistical basis used for making both long and short time frame decisions

Step three......We show struggling traders how to "stop the bleeding" (when not to trade). We go on
to show traders how to recognize favorable opportunities, and how to manage emotions when trading
(We show traders how to create "winning" self dialogue and minimize "catastrophic" scenario creation).

We offer these options and the client decides what they need.
 
Last edited:
A very easy and profitable open opportunity today

If a trader took the time to properly prepare, this was
an obvious short, after the opening test of the 20 period
Ema (on the daily chart to the extreme right)

The general rule of thumb is that the institutions make
decisions based on the longer time frame charts. THIS
is why we always refer FIRST, to that chart to find patterns
and opportunities to enter high probability trades

The "trick" if there is one, is to 1) know this (the above mentioned
fact about institutional behavior) 2) to recognize the opportunity
and to evaluate the odds accurately, 3) to Act decisively (to enter
at the right time, and finally have the emotional control necessary
to hold the position long enough to obtain the full benefit.

Typically retail traders fail on items 1 & 2. Those who happen by
sheer luck to take the trade, often have problems controlling emotion
OR are so risk averse that they cannot hold (instead they trade "for ticks")
and the result is that they never make enough money on the winners
to overcome the losing trades that are a part of this profession.

Notice that our screen display consists of three parts. On the left we have
one chart split in half, with 15 min on one side, 5 min on the other. This
allows us to show traders how to recognize the entries on either time frame.
On the right side, we have a Ninjatrader chart showing daily candles and
with a 20 period EMA in place. This allows us to see the bigger (institutional)
picture, and to execute quickly as may be necessary to get in promptly. It also
helps to determine (on the longer time frame) where the price or range of prices
where institutions are likely to either exit, add, or close out inventory. We try to
remind retail traders that the big institutions are most likely "Always In".
 

Attachments

  • Test-Retest of Daily 20 Ema.PNG
    Test-Retest of Daily 20 Ema.PNG
    169.6 KB · Views: 11
Last edited:
Final Chart for this very productive Friday session

We show both the 15min and 5 min charts side by side

This really helps traders who are struggling to identify opportunity

At the start of the Euro/USA Overlap, we see price create an hour long
trading range condition. At the end of the hour, price breaks to the upside
then retraces or pullsback to test the VWAP (black dots). Aggressive professional
traders will enter long, and add to their positions all the way up. In fact smart
commercial traders will continue to add as long as the candles close strong
(at or near the highs).

If a reader were paying attention (to my previous posts) they might remember
a comment that these events can be anticipated, and often occur toward the
end of the week (a common "time based pivot")

This behavior is part of the "wholesale/retail" model that has been used profitably
by commercial traders over the years.
 

Attachments

  • Breakout Pullback Continuation Example.PNG
    Breakout Pullback Continuation Example.PNG
    122.7 KB · Views: 8
Today, as we prepare for another class, we show the Basic Template that we teach
our students to use

CONTEXT

One of the basic concepts of our approach to trading is to provide Basic or "Key" References
These can vary depending on the market, however one thing that does NOT vary is the VWAP
Envelope. This envelope consists of a central point or line that is called the VWAP Median
We provide the (statistical) basis for this to our students and it is important, because institutions
use this as their PRIMARY REFERENCE for moving price from one place to another using a model
that we call the "Wholesale/Retail" cycle

The VWAP Median is shown as Black dots forming a line. VWAP is the "Volume Weighted Average Price"
We assume that serious traders will do the basic research to learn the definition of this important concept.

About this central point (VWAP) we see a darker middle area known as the 1st Standard Deviation Band and further
away from the VWAP Median, we have the 2nd Standard Deviation Band. For our purposes, we assume that most
price movement (on a weekly basis) is going to be "contained" within this framework. Again for our classes, we
teach the statistical basis so that traders wanting to obtain professional status, can use information as the basis
for entry and exits.

WHOLESALE/RETAIL CYCLE

This is well known in business generally. In many businesses, the owner/operator will purchase inventory
at one price (known as the "Wholesale" price) then sell it to the customer at the "Retail" price, thus realizing
a profit

In the financial markets, this works both ways, as institutions sell inventory (shares, contracts) at a relatively
high price (known as the "retail" price), then buy inventory back at a lower price, again realizing a profit
This cycle can be seen on every time frame. One advantage of using our VWAP envelopes is that it makes
it possible for the trader to "see" the cycles, as institutions prepare to report earnings at specific dates
(Quarterly for example). We teach traders to use this cycle as the basis for their business model as well.

We attach a screen shot to show the basic framework we use, which is a single chart with 30 minute candles
and we extend lines from each envelope to the next to provide points of reference (Key References) that
allow us to see where we are in this "cycle" and whether we are trending or in a trading range on any time
frame

For this example we have removed the candles to show one possible basic structure (Weekly). This example
shows on one screen, how the market is moving (trending or trading range) from Monday to Friday. It can be
adapted to a monthly or quarterly cycle so that longer time frame traders and investors can make use of it.
 

Attachments

  • Basic Framing Template.PNG
    Basic Framing Template.PNG
    129 KB · Views: 7
Last edited:
Following up on the previous post, we attach the same template with 30 minute candles in place

One of the primary skills we teach is how to "Mark up" each day's chart, so that the trader can
determine 1) whether the market is trending or in a trading range and 2) where we are in the
"Wholesale/Retail" Cycle. This allows us to anticipate when we might see the market move up
or down as institutions "mark up" or "mark down" in order to take profits on various time frames.

We cover various subjects including how to participate in this primary cycle.
 

Attachments

  • Basic Framing Template 2.PNG
    Basic Framing Template 2.PNG
    141.3 KB · Views: 6
Attached below we show a chart that illustrates one of the basic principles of statistics
as regards distribution of data (prices). We see price moving (both trend and trading range)
until we get to the edge of the distribution, and then, a move back toward the central
VWAP as institutions take profits. Remember that today is June 1st. A skilled trader
knowing how to evaluate the cycle, could have anticipated yesterday's move
This one day, could have provided significant profits, if traded intelligently.

Aggressive professionals took up to 60 pts profit based on early entry

Over the next few days, it will be interesting to see if anyone recognizes the
extent of the opportunity this approach provides to folks willing to do the
work necessary to create a sustainable business model.
 

Attachments

  • Basic Framing Template 3.PNG
    Basic Framing Template 3.PNG
    134 KB · Views: 7
Last edited:
I am attaching a chart that I use to show the pending economic events schedule for each trading day

I simply type in the pending events (prior to the open) to remind myself that I have to be aware of
the timing of new (high impact only) data entering the market on a specific day and time.

This also helps me to anticipate trading range days. The best examples are days that proceed
the FED announcements and release of FED minutes. Also helps during earnings season, when
Goog, Apple, Meta, NVIDIA and others may have market moving data to report. I enter all of
it as text above the session display, I toggle back and forth between this and my 15 min & 5 min
charts.

Finally on a sheet of paper I mark the status of the DOW (up or down by percentage) every 30 minutes
I find that this helps me to maintain my focus.
 

Attachments

  • Economic Release Screen.PNG
    Economic Release Screen.PNG
    175.4 KB · Views: 6
Last edited:
Top