rossored
Senior member
- Messages
- 2,103
- Likes
- 56
I realised it was quite a while since I started a thread in the forums, so I thought I'd start one which may or may not encourage some debate. I know that I work for T2W and all that, but I dont see that that ought to make any difference, so here we go.
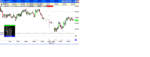
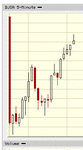
Something struck me today whilst looking at a chart of the Dow.
Part of me looks at the first part-chart (taken from bigcharts, btw) and sees the following:
Big gap down, some choppy-ish price action making a series of higher lows, but no higher highs - so "traditional TA" would have you believe - using this chart alone - that you've got a descending triangle forming here, and a big one too, as this is a 5min chart.
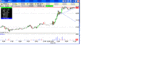
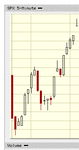
The other part of me looks at this second chart (taken a few minutes later) and thinks "What a load of tosh. All this about descending tris (and some other notorious TA patterns) is rubbish. What we've got here is nothing other than a series of HL's and HH's - its not a desc. tri at all."
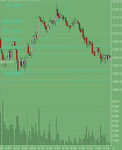
Of course, this is backed up by the same chart of the S&P (third part-chart), which shows nothing like a triangle, descending or otherwise, at any time during this time period. It only shows HH's and HL's.
So....
a) does the S&P act as a "leading indicator" (shudders at use of 'indicator' word) in this case?
b) Are 'traditional' (tris, wedges, etc) TA patterns too complex? Should we just use (as many advocate) simple analysis - S/R lines, Volume and HH/HL etc, and forget all the other baloney? Because it strikes me that all too often, it doesnt work anyway.
(I didnt trade any of this as I was busy with something else, and I'm not asking for answers per-se to either of the above either - I just want some opinions)
Something struck me today whilst looking at a chart of the Dow.
Part of me looks at the first part-chart (taken from bigcharts, btw) and sees the following:
Big gap down, some choppy-ish price action making a series of higher lows, but no higher highs - so "traditional TA" would have you believe - using this chart alone - that you've got a descending triangle forming here, and a big one too, as this is a 5min chart.
The other part of me looks at this second chart (taken a few minutes later) and thinks "What a load of tosh. All this about descending tris (and some other notorious TA patterns) is rubbish. What we've got here is nothing other than a series of HL's and HH's - its not a desc. tri at all."
Of course, this is backed up by the same chart of the S&P (third part-chart), which shows nothing like a triangle, descending or otherwise, at any time during this time period. It only shows HH's and HL's.
So....
a) does the S&P act as a "leading indicator" (shudders at use of 'indicator' word) in this case?
b) Are 'traditional' (tris, wedges, etc) TA patterns too complex? Should we just use (as many advocate) simple analysis - S/R lines, Volume and HH/HL etc, and forget all the other baloney? Because it strikes me that all too often, it doesnt work anyway.
(I didnt trade any of this as I was busy with something else, and I'm not asking for answers per-se to either of the above either - I just want some opinions)
") )
)